

Revenue, month on month
Current revenue with the change against last month, so a dip is visible as soon as it starts.

The Connect CRM dashboard shows revenue against last month, how many connections sit in each stage and how that changed, with the full connection list one click away.
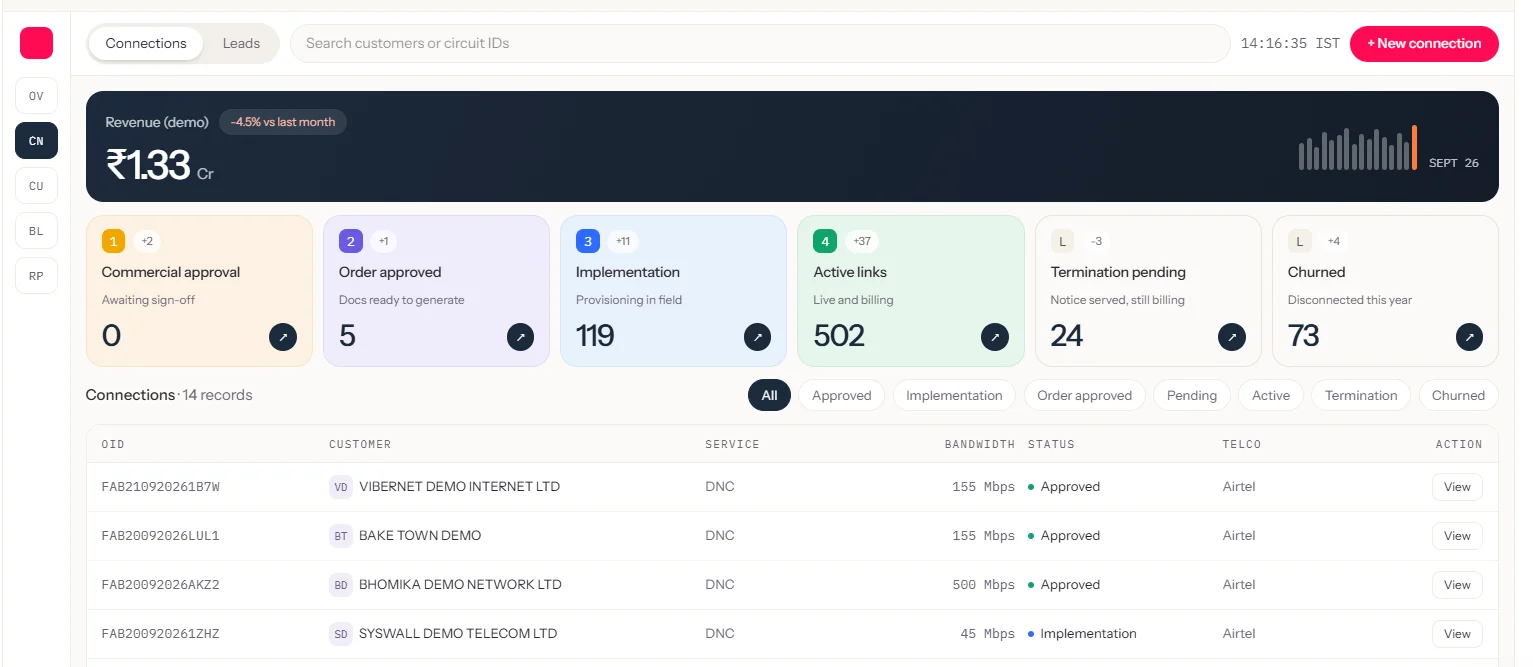
Connect CRM with sample data
When numbers live in spreadsheets, someone has to compile them before anyone can decide anything, and by then they are already out of date.
Current revenue with the change against last month, so a dip is visible as soon as it starts.
Live counts for commercial approval, order approved, implementation, active, termination pending and churned, with recent movement.
Filter connections by status, or search by customer or circuit ID, to go from a number to the records behind it.
A manager sees 24 links in “Termination pending”, opens the stage, and calls the biggest accounts before their notice period runs out.